Veerapathra Transport · Thanjavur · Tamil Nadu
The driver who earned more — and took home less
A real per-trip P&L story from a 2-truck Indian fleet
- Window
- 7 March 2026 → 23 May 2026
- 3 P&L cycles · 40 trips
- Fleet
- 2 trucks · 2 drivers
- Tooling
- Fleetbooks per-trip P&L
- Leak identified
- ₹12,616
- over 78-day window
TL;DR
The top-earning driver produced ₹12,616 less profit than the fleet's #2 — despite higher gross revenue per trip.
The entire swing sat in one expense column — loading + unloading fees — that most owner-drivers don't line-item separately.
Sample: 40 trips (Kumar 19 + Senthil 21) over 78 days. IQR overlap shown in Figure 3 for confidence at this n.
| Driver | Kumar (vanity #1) | Senthil (profit #1) | Δ |
|---|---|---|---|
| Trips | 19 | 21 | |
| Revenue / trip | ₹36,646 ▲ | ₹35,800 | +₹846 in Kumar's favour |
| Profit / trip | ₹10,579 | ₹11,243 ▲ | −₹664 against Kumar |
| Load + unload / trip | ₹3,428 (9.4%) | ₹2,098 (5.9%) | +63% on Kumar's side |
| Profit lost in window | −₹12,616 | reference |
01 · Setup
The question every owner asks.
Two trucks. Two drivers. Same crops, same lanes, same diesel price, same bata norms.
The owner's intuition was: "Kumar runs longer trips and brings in more revenue per ticket — he's our top earner."
That's exactly the trap Fleetbooks was built to catch.
A note on language: when we say Kumar "took home less," we mean less profit for the fleet, not lower bata for the driver. Kumar's personal pay didn't change. The owner's take did.
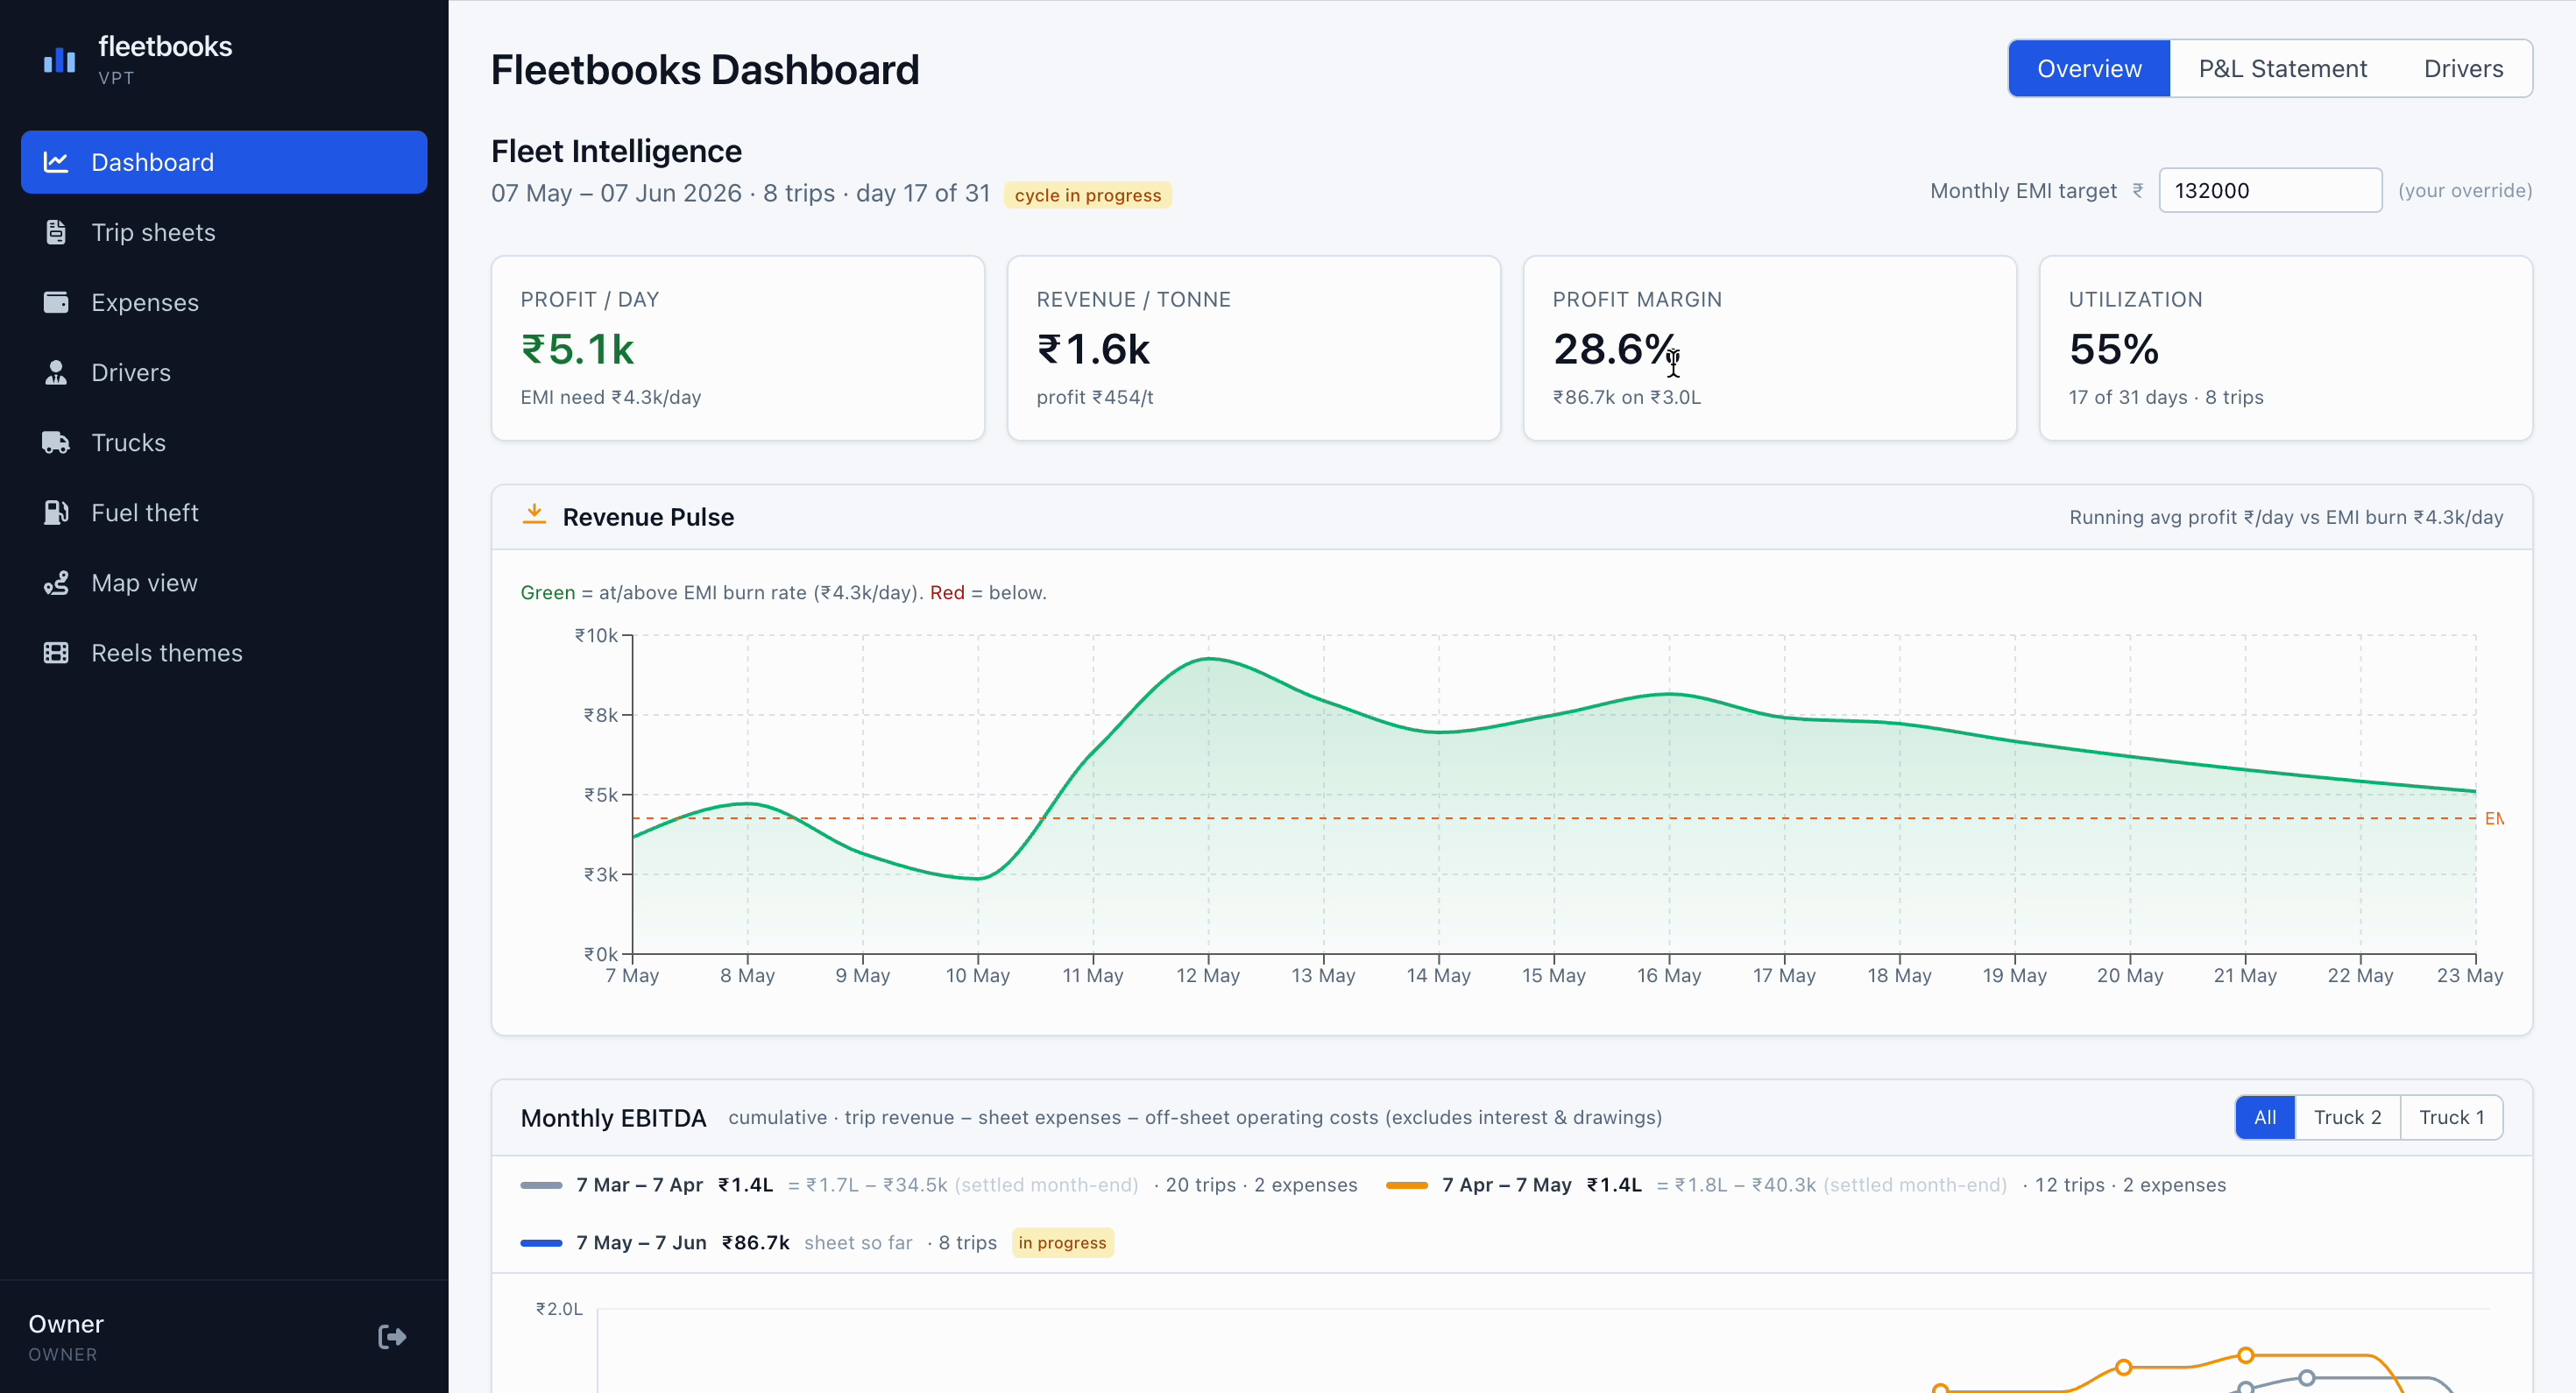
02 · The vanity number
Revenue per trip — and where it misleads.
On revenue alone, Kumar wins. He averages ₹36,646 per trip vs Senthil's ₹35,800 — a ₹846 advantage per ticket.
If you stop here (and most fleet owners stop here), you'd hand Kumar the better routes, the better truck, maybe a bonus.
03 · The reveal
Switch to profit per trip — and the ranking flips.
- Senthil: ₹11,243 profit / trip (margin 31.4%)
- Kumar: ₹10,579 profit / trip (margin 28.9%)
A ₹664 per-trip profit gap against the supposed top earner.
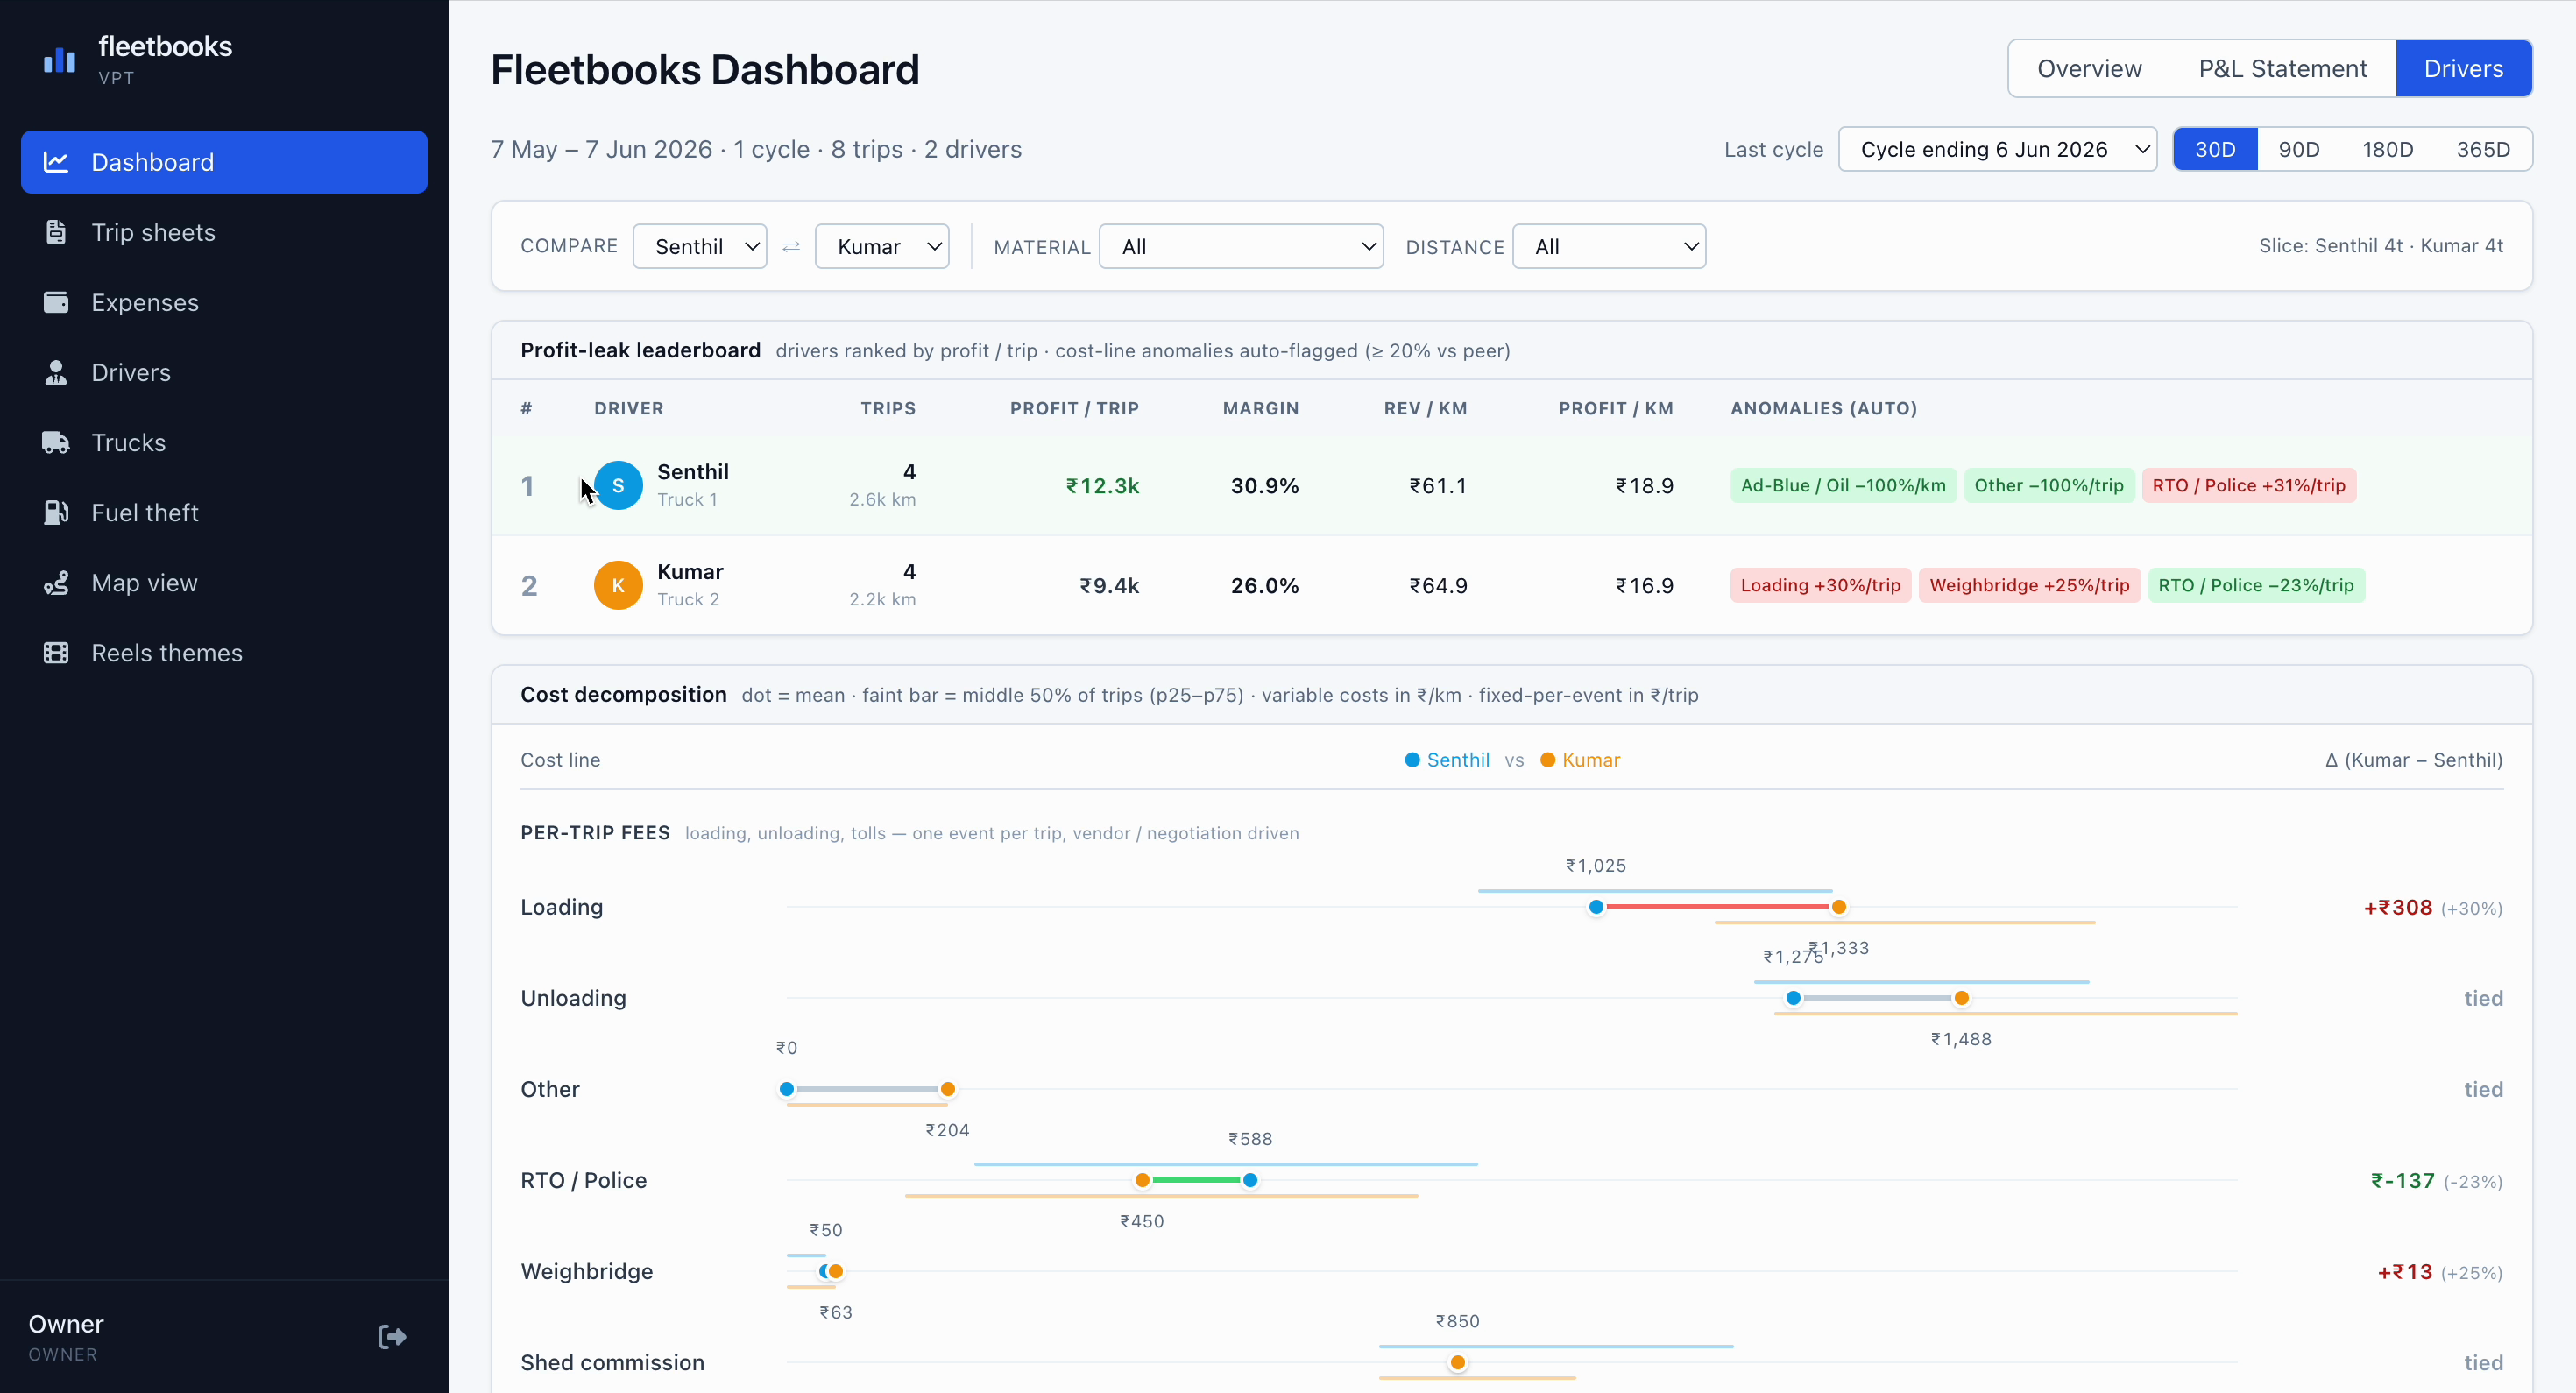
04 · Cost decomposition
Line by line, on the right denominator.
The dumbbell chart below the leaderboard puts every expense column on the same axis, with the right denominator per line (₹/trip for fixed-per-event fees, ₹/km for distance-scaled costs).
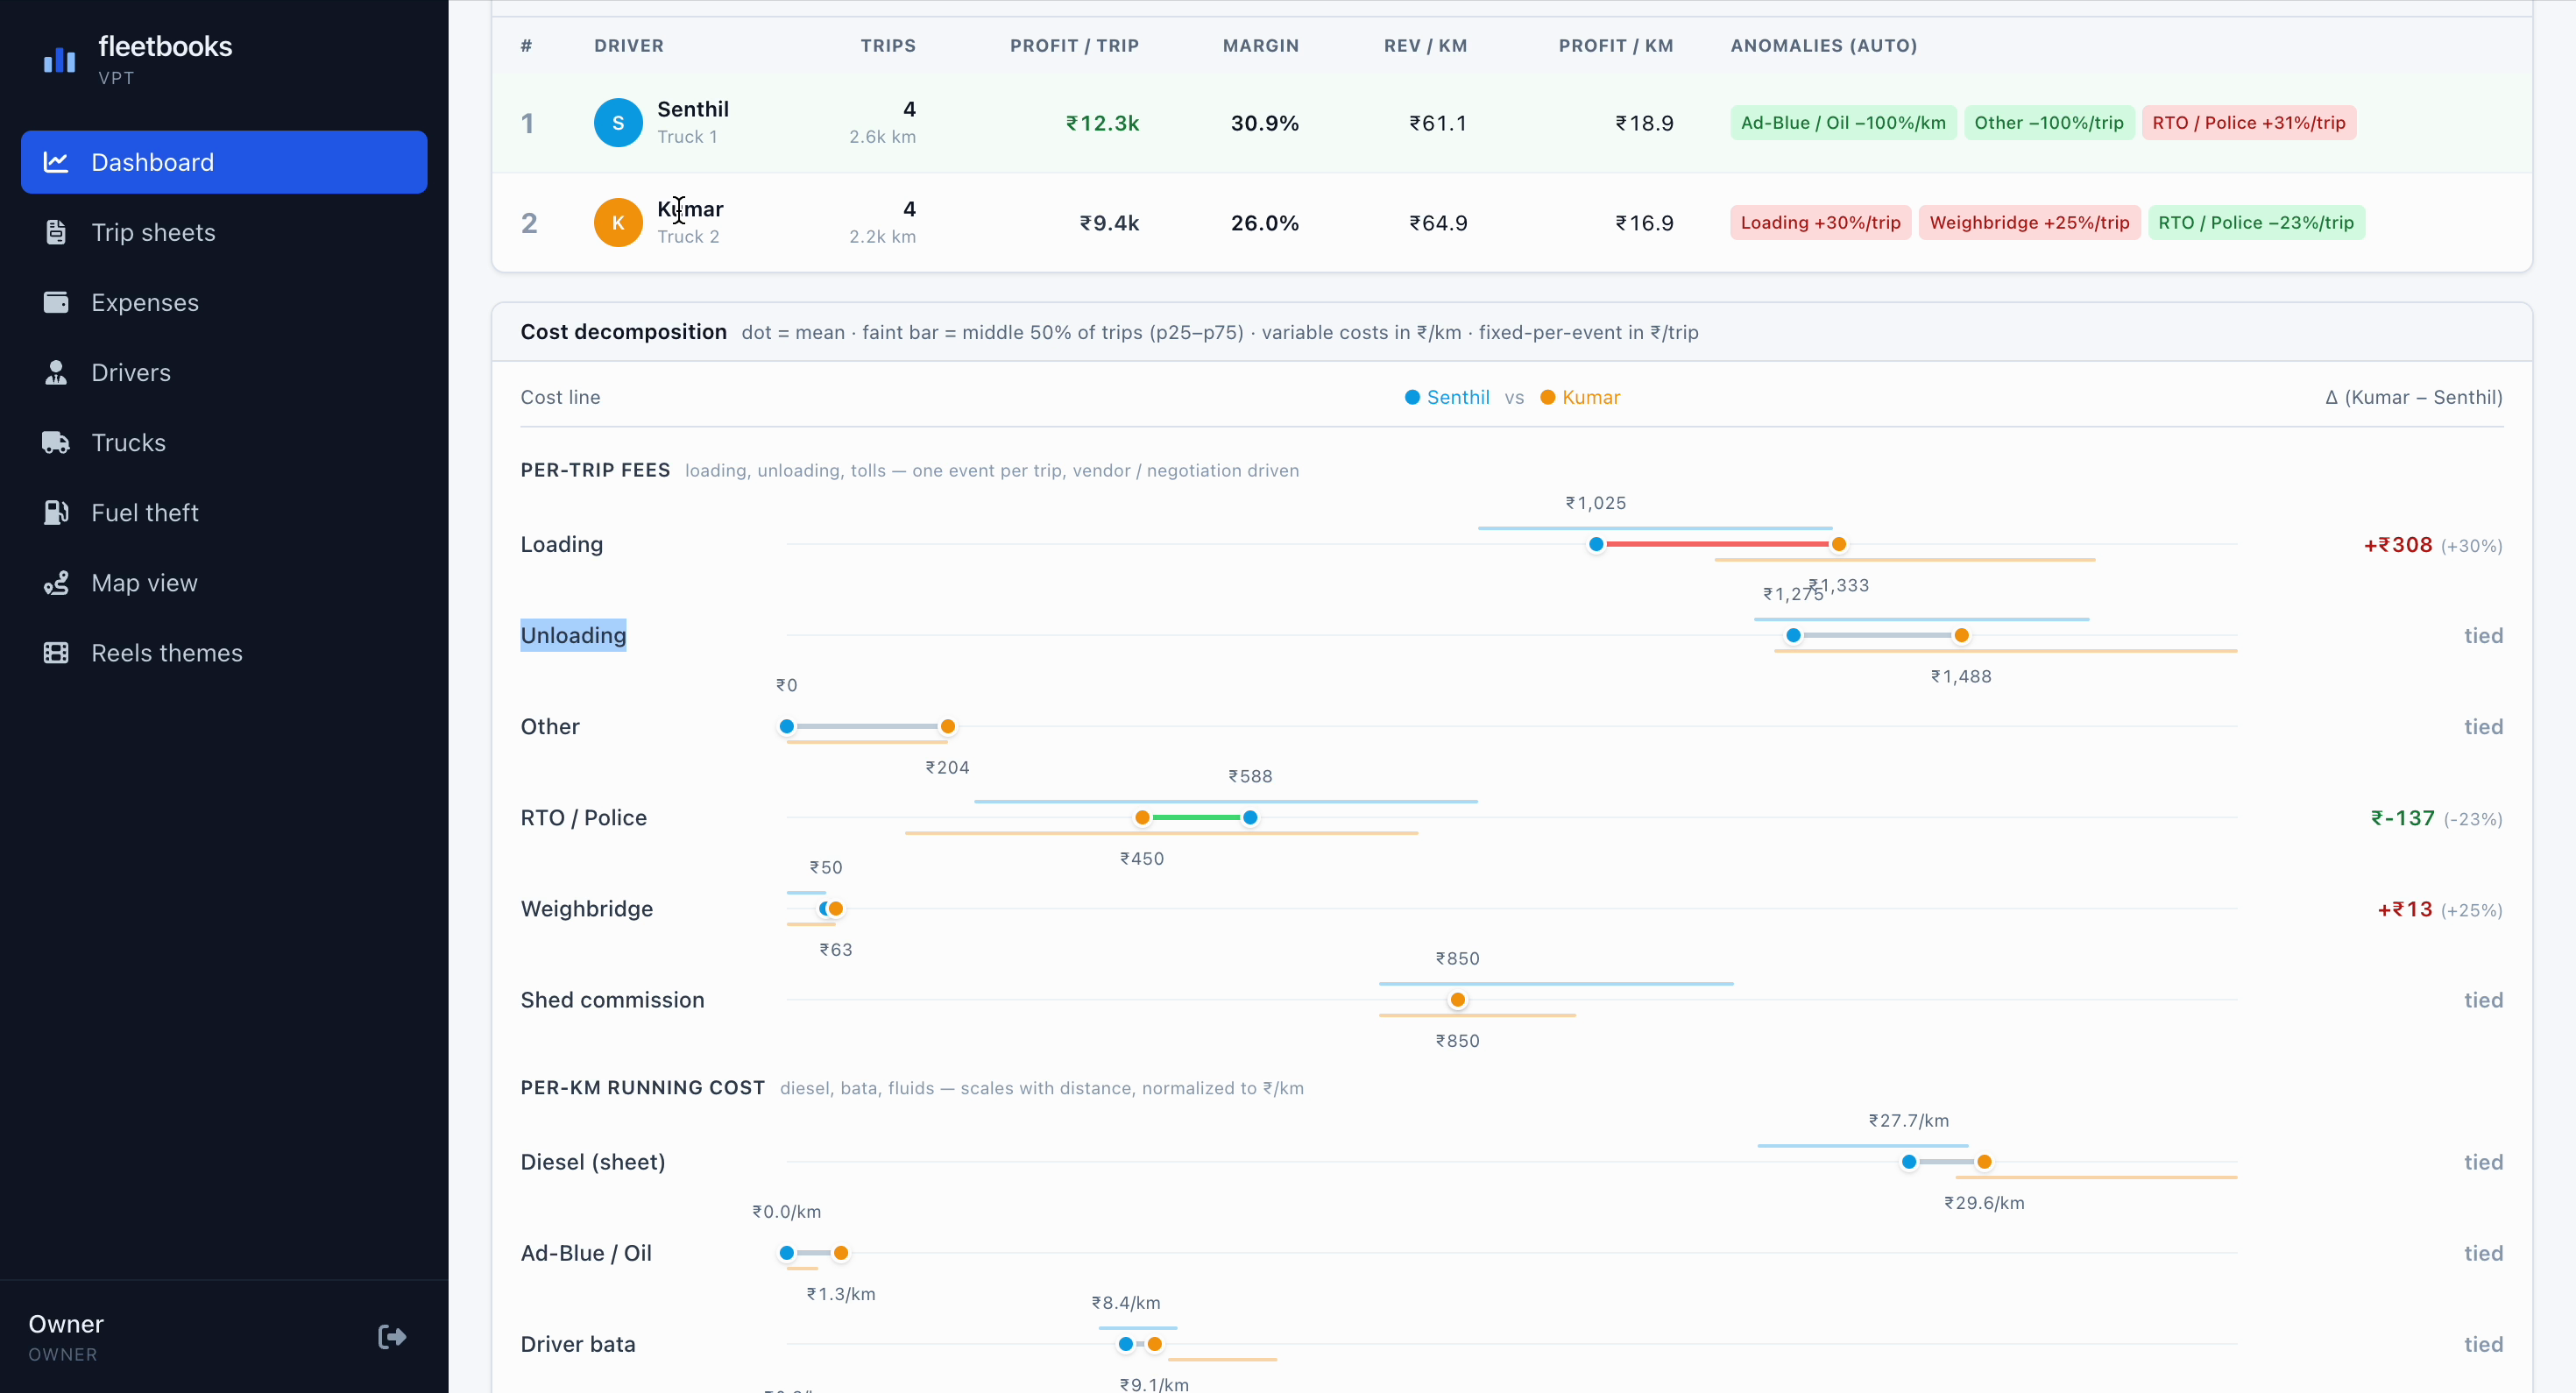
Per-trip fees (₹ per event, vendor / negotiation-driven)
| Cost line | Senthil avg | Kumar avg | Δ (Kumar − Senthil) | Flag |
|---|---|---|---|---|
| Loading | ₹1,025 | ₹1,333 | +₹308 (+30%) | Kumar high |
| Unloading | ₹1,275 | ₹1,488 | +₹213 (+17%) | within ±20% |
| Other | ₹0 | ₹204 | +₹204 | within ±20% |
| RTO / Police | ₹588 | ₹450 | −₹137 (−23%) | Senthil high |
| Weighbridge | ₹50 | ₹63 | +₹13 (+25%) | Kumar high |
| Shed commission | ₹850 | ₹850 | tied |
Aggregate: load + unload alone costs Kumar ₹1,330 more per trip (₹3,428 vs ₹2,098 — a 63% gap).
Per-km running cost (scales with distance)
| Cost line | Senthil | Kumar | Δ |
|---|---|---|---|
| Diesel (sheet) | ₹27.7 / km | ₹29.6 / km | +₹1.9 / km (~7%, tied) |
| Driver bata | ₹8.4 / km | ₹9.1 / km | tied |
| Ad-Blue / Oil | ₹0.0 / km | ₹1.3 / km | small absolute |
Diesel and bata sit inside the ±20% anomaly band (Kumar +6.9% on diesel, bata effectively flat). IQRs overlap on the dumbbell at this sample size — secondary signals, not the leak.
05 · Operational diagnosis
Why this happens.
Loading & unloading fees in Tamil Nadu lorry ops are negotiated trip-by-trip with the hamali / shed crew. Rates vary by:
- Crop (rice gunnies vs loose paddy vs cement)
- Crew of the day (regular crew = lower; replacement crew = higher)
- Time of day (after-hours premium)
- Whether the driver pushes back
Kumar's pattern over 19 trips suggests he's accepting whatever the crew quotes; Senthil's lower numbers suggest he's bargaining or working with cheaper regulars. There's no procurement contract for these vendors — pricing is purely driver-discretionary.
This is why the leak hides:
- Trip-sheet totals show only one line:
finalAmount(the EBITDA proxy) - Aggregated monthly P&L bundles load + unload into "operating costs"
- Per-driver, per-cost-line view requires breaking the totals open
- Most accountants don't categorise hamali charges per driver
Fleetbooks computes this per trip and surfaces the anomaly badge once a driver's average on any line deviates ≥ 20% from peer median.
06 · The fix
What the owner actually did.
01
Rate card
Owner asked Senthil to share his typical hamali quotes by route. Built an informal rate-card sheet kept in both trucks.
02
Driver awareness
Showed Kumar his own per-trip profit number (not revenue). Once he saw the personal P&L, the negotiation pushback started naturally.
03
Weekly review
The leaderboard now gets a 5-min review every Sunday — anomaly badges are the agenda.
No vendor was changed. No truck was reassigned. No bata was cut. The fix was visibility, not procurement — once Kumar saw his own per-trip profit line (not just revenue), the pushback at the shed crew started naturally. The next cycle's data isn't in this case study yet; we'll publish a follow-up once cycle 4 closes.
07 · Product takeaway
Spreadsheet vs Fleetbooks.
This case study is the canonical demo of what Fleetbooks does that a normal spreadsheet doesn't:
| Source you'd use today | What it shows | What Fleetbooks shows |
|---|---|---|
| Spreadsheet / WhatsApp ledger | Monthly revenue per truck | Per-trip revenue and profit per driver |
| Spreadsheet / WhatsApp ledger | Total expenses by category | Each expense column on the right denominator (₹/km vs ₹/trip) |
| Spreadsheet / WhatsApp ledger | P&L statement at month-end | Live leaderboard with anomalies auto-flagged ≥ 20% vs peer median |
| Spreadsheet / WhatsApp ledger | Diesel and bata (because they're big) | Every fee column, including the ones owners forget |
| GPS-tracker SaaS (BlackBuck, Fr8, WheelsEye) | Truck position, ePOD, freight matching, fuel pings | Per-trip P&L, per-driver cost decomposition, anomaly badges — once the load is booked, we run the back office |
In hard numbers, for this fleet: ₹12,616 visible over 78 days on a fleet that grossed ~₹14.5L in the same window. That's ~0.9% of revenue — small as a percentage, large in absolute terms for an owner-operator running on EMI. Linear extrapolation: ~₹59K per year leaking on one cost line between two drivers.
Scaling math (route-mix similar, same loading-fee dispersion): a 5-truck fleet on the same lanes carries roughly 2.5× the annual leak → ~₹1.5L / year. A 20-truck fleet → ~₹6L. The gap compounds with driver count, not revenue scale — which is why mid-fleet owners (5–25 trucks) feel this hardest: they have enough drivers to leak, not enough margin to absorb it.
08 · Methodology
Numbers and method, audited.
- Source
trip_sheetstable, joined withexpensestable per trip- EBITDA basis
- Revenue − trip-sheet expenses − Direct operating − Repairs & maintenance − Insurance & taxes − Other operating
- Profit / trip
- (revenue − all expenses) / trip count
- Anomaly threshold
- ≥ 20% deviation from peer median and ≥ ₹100 absolute impact per trip — the absolute floor prevents tiny-base lines (e.g. weighbridge ₹13 / +25%) triggering noise badges. Basis is per-km for variable costs, per-trip for fixed-per-event fees.
- Cycle convention
- VPT P&L runs 7th → 6th of next month (not calendar)
- Sample size (n)
- 19 trips (Kumar) + 21 trips (Senthil) over 78 days
Run the same analysis on your fleet
Send us one cycle. We'll find your leak.
WhatsApp us one month of trip sheets. We run the exact per-driver, per-cost-line decomposition you saw above and walk you through it on a 15-minute call. No commitment, no sign-up.
Or message +91 63010 23968 directly.